NCERT Solutions for Class 10 Maths Chapter 14 Statistics Exercise are prepared by specialised experienced mathematic teacher. Maths are most important subject of board and with the help of this chapter-wise NCERT solution and little practices you can get very good marks in your respective board exam. It also help students to build a foundation of upcoming class 11th and 12th. Student can also check the Important Question with solution for class 9 to class 12.
Also Check – To known more about latest Mobile, Laptop and other gadget click here
Class 10 Maths Chapter 14 Statistics Exercise Exercise 14 contain total 4 exercise that has 25 questions and questions based on find mean, mode or median of grouped data will be studied in this chapter. Check Previous chapter – NCERT Solutions for Class 10 Maths Chapter 13 Surface Areas and Volumes Exercise 13
Exercise 14.1
Question 1.
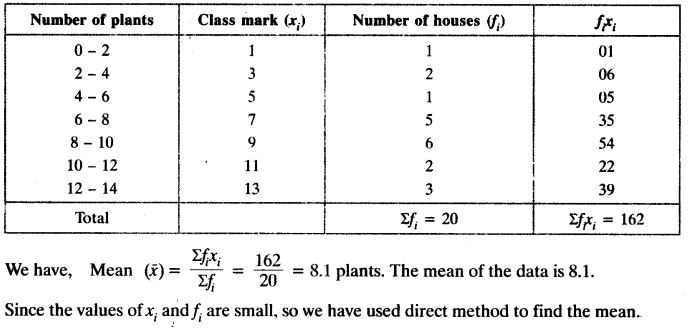
A survey was conducted by a group of students as a part of their environment awareness programme, in which they collected the following data regarding the number of plants in 20 houses in a locality. Find the mean number of plants per house.
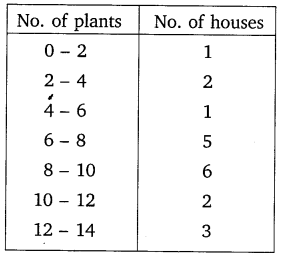
Which method did you use for finding the mean, and why?
Solution:
Question 2.
Consider the following distribution of daily wages of 50 workers of a factory.
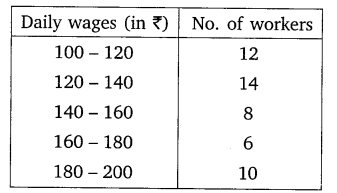
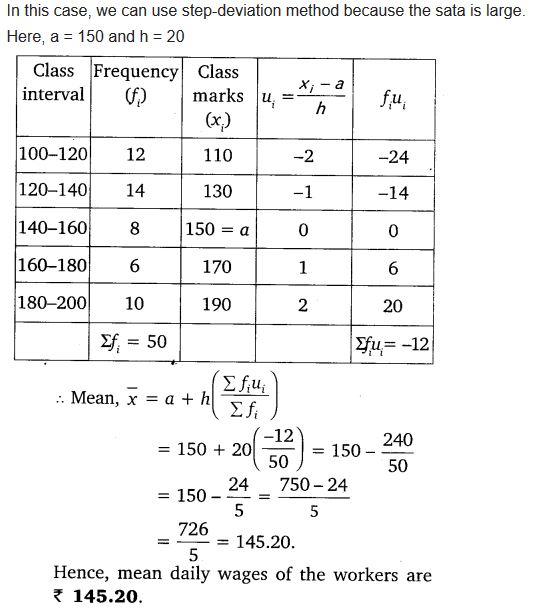
Find the mean daily wages of the workers of the factory by using an appropriate method.
Solution:
Question 3.
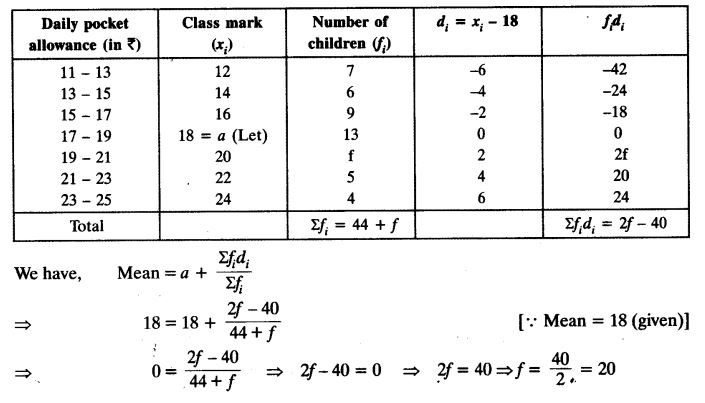
The following distribution shows the daily pocket allowance of children of a locality. The mean pocket allowance is ₹ 18. Find the missing frequency f.
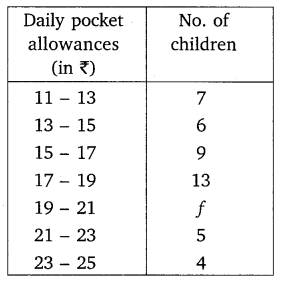
Solution:
Question 4.
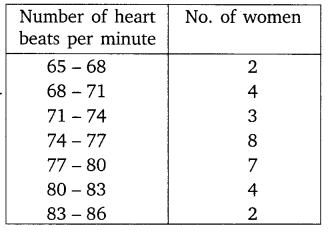
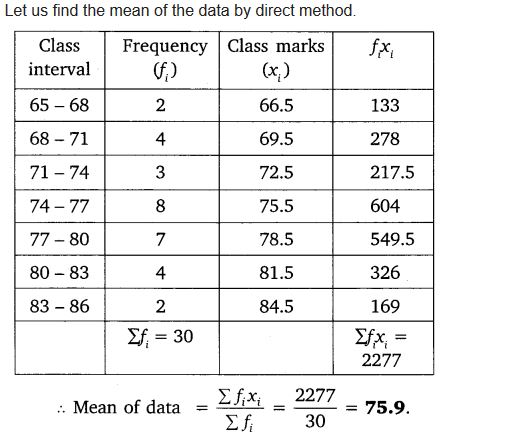
Thirty women were examined in a hospital by a doctor and the number of heart beats per minute were recorded and summarised as follows. Find the mean heart beats per minute for these women, choosing a suitable method
Solution:
Question 5.
In a retail market, fruit vendors were selling mangoes kept in packing boxes. These boxes contained varying number of mangoes. The following was the distribution of mangoes according to the number of boxes.
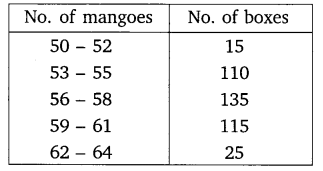
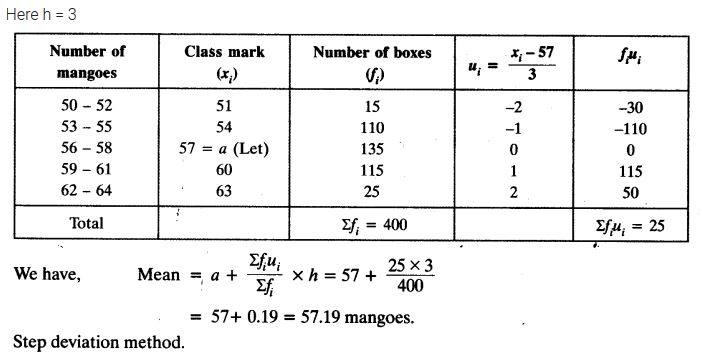
Find the mean number of mangoes kept in a packing box. Which method of finding the mean did you choose?
Solution:
Question 6.
The table below shows the daily expenditure on food of 25 households in a locality.
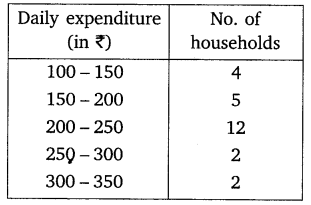
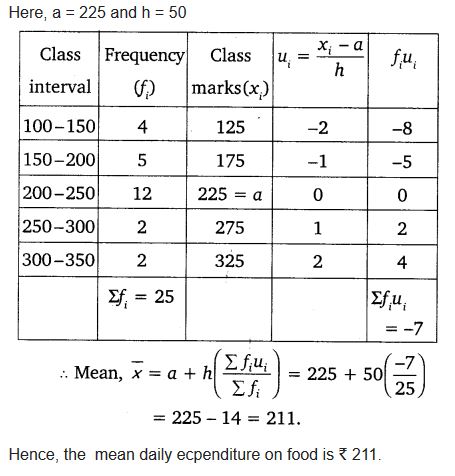
Find the mean daily expenditure on food by a suitable method.
Solution:
Question 7.
To find out the concentration of SO2 in the air (in parts per million, i.e. ppm), the data was collected for 30 localities in a certain city and is presented below:
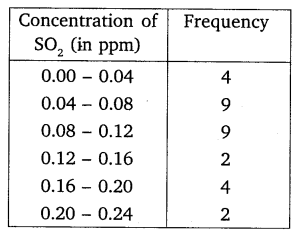
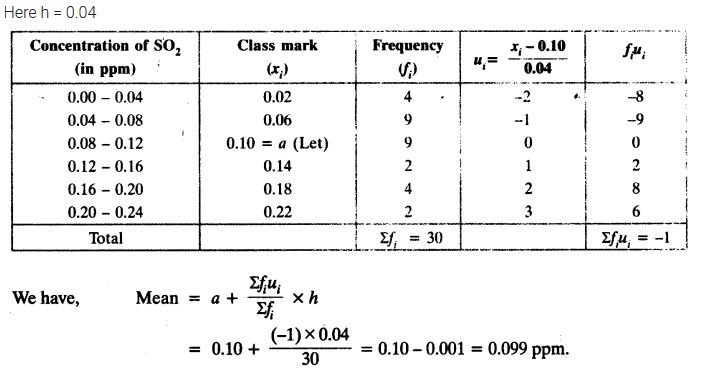
Find the mean concentration of SO2 in the air.
Solution:
Question 8.
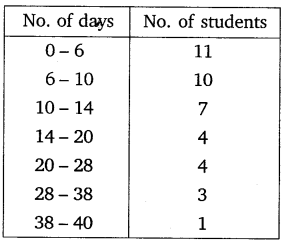
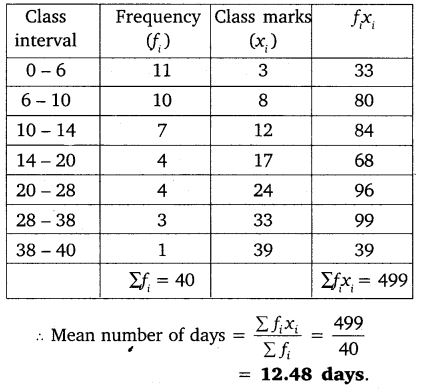
A class teacher has the following absentee record of 40 students of a class for the whole term. Find the mean number of days a student was absent.
Solution:
Question 9.
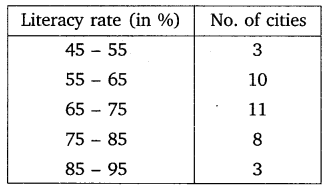
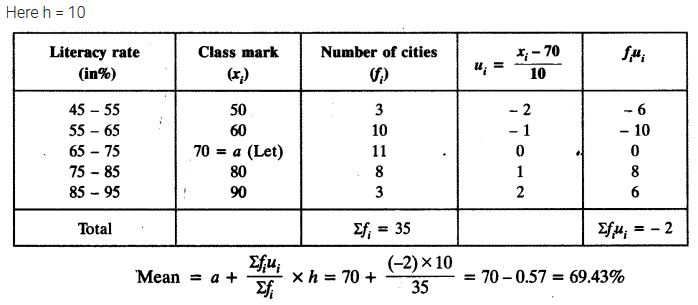
The following table gives the literacy rate (in percentage) of 35 cities. Find the mean literacy rate.
Solution:
Exercise 14.2
Question 1.
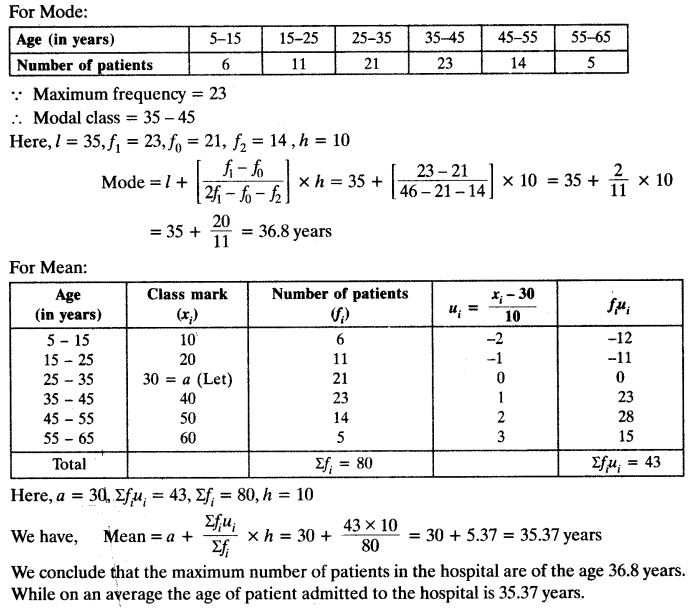
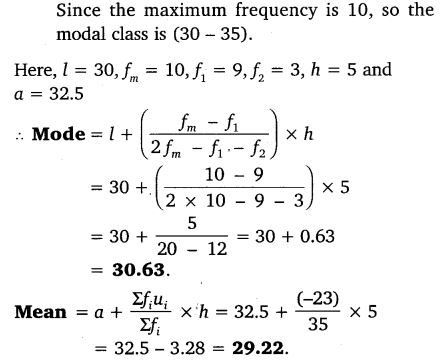
The following table shows the ages of the patients admitted in a hospital during a year.
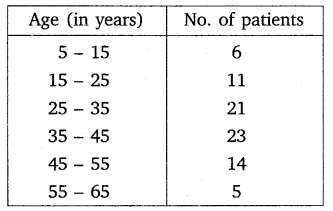
Find the mode and the mean of the data given above. Compare and interpret the two measures of central tendency.
Solution:
Question 2.
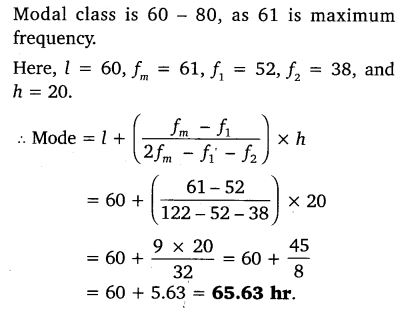
The following data gives information on the observed lifetimes (in hours) of 225 electrical components:
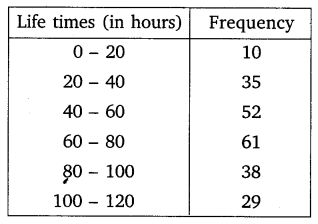
Determine the modal lifetimes of the components.
Solution:
Question 3.
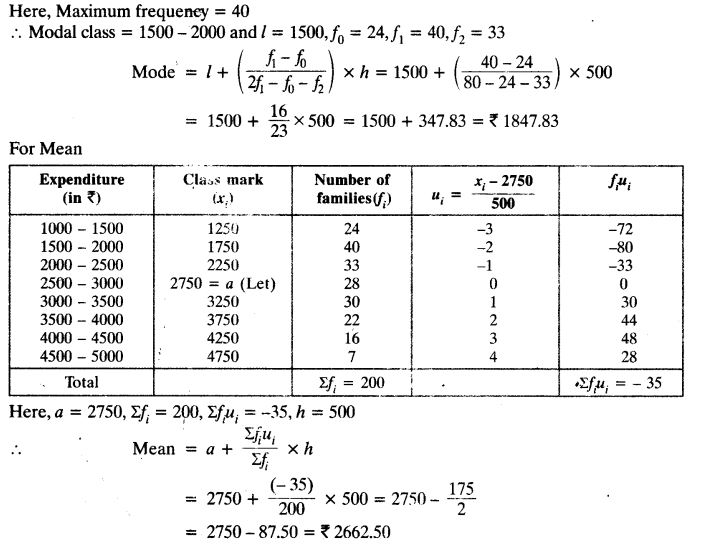
The following data gives the distribution of total monthly household expenditure of 200 families of a village. Find the modal monthly expenditure of the families. Also, find the mean monthly expenditure:
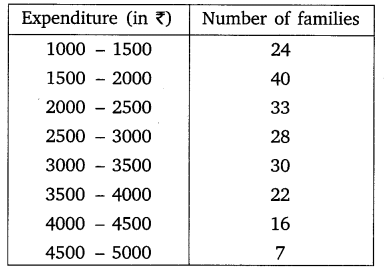
Solution:
Question 4.
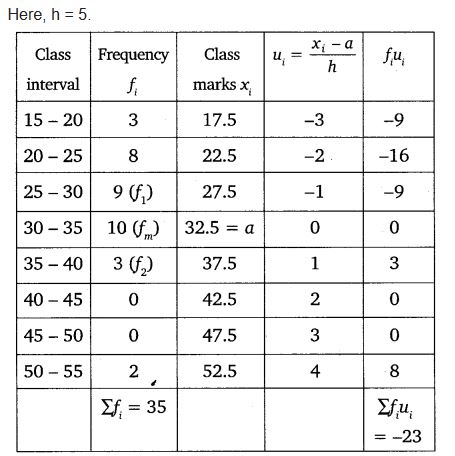
The following distribution gives the state-wise teacher- student ratio in higher secondary schools of India. Find the mode and mean of this data. Interpret the two measures.
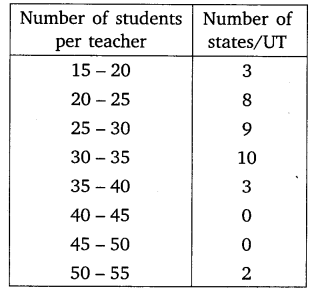
Solution:
Question 5.
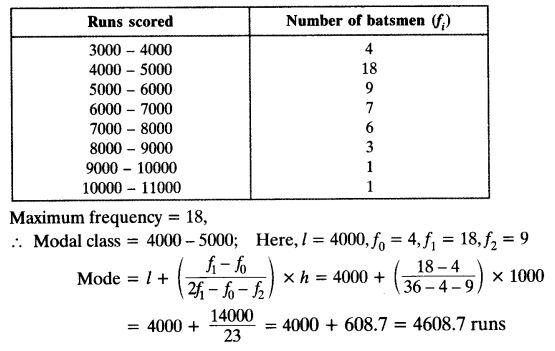
The given distribution shows the number of runs scored by some top batsmen of the world in one-day international cricket matches.
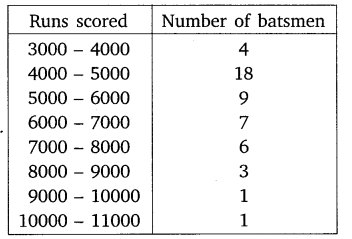
Find the mode of the data.
Solution:
Question 6.
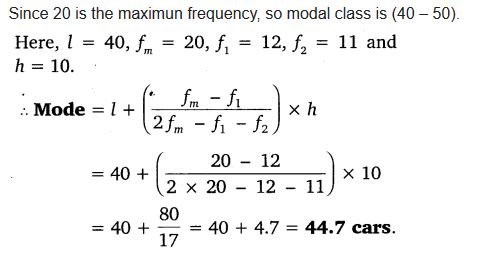
A student noted the number of cars passing through a spot on a road for 100 periods each of 3 minutes and summarised it in the table given below. Find the mode of the data:
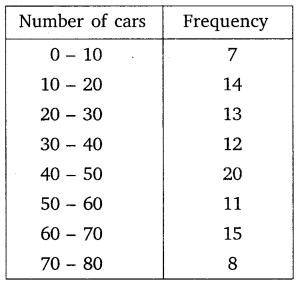
Solution:
Exercise 14.3
Question 1.
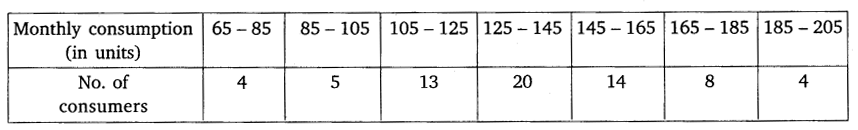
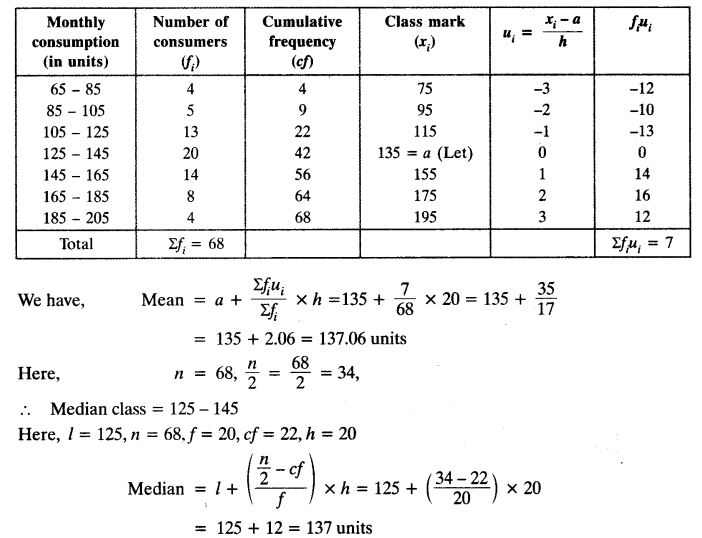
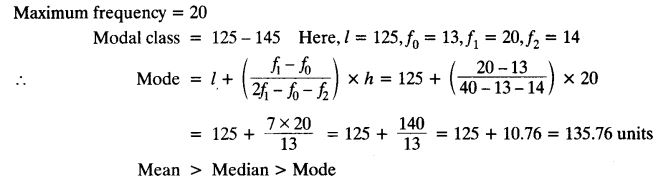
The following frequency distribution gives the monthly consumption of electricity of 68 consumers of a locality. Find the median, mean and mode of the data and compare them.
Solution:
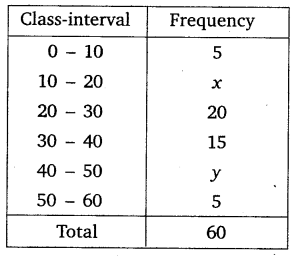
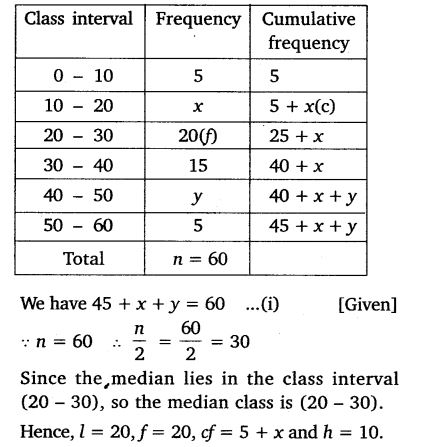
Question 2.
If the median of the distribution given below is 28.5, find the values of x and y.
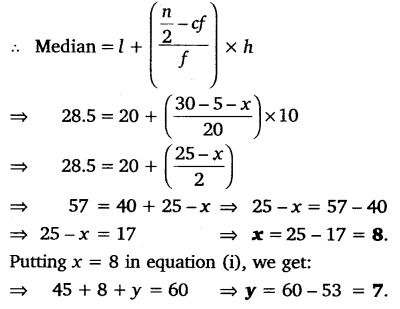
Solution:
Question 3.
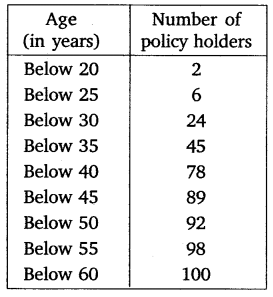
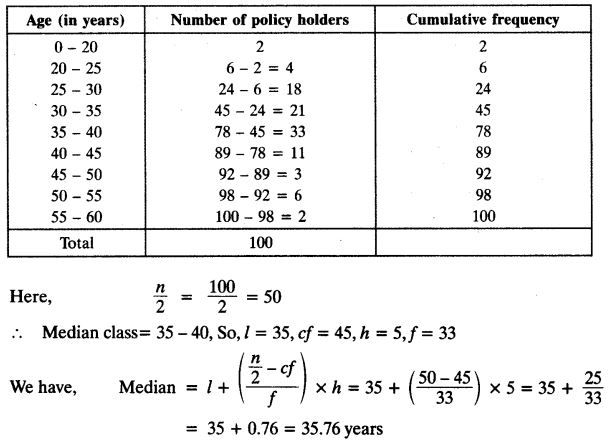
A life insurance agent found the following data for distribution of ages of 100 policy holders. Calculate the median age, if policies are given only to persons having age 18 years onwards but less than 60 years.
Solution:
Question 4.
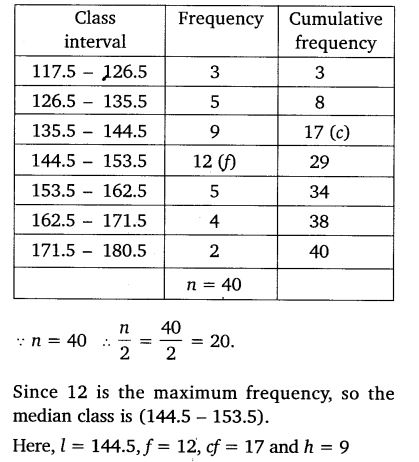
The lengths of 40 leaves of a plant are measured correct to nearest millimetre, and the data obtained is represented in the following table:
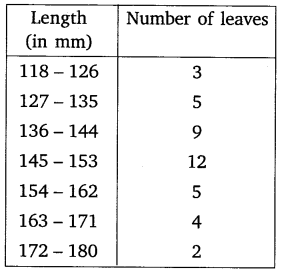
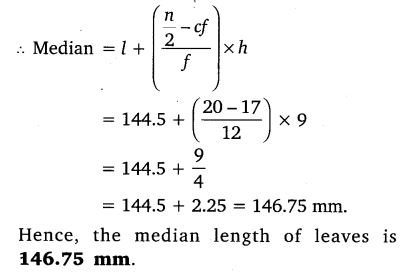
Find the median length of the leaves.
Solution:
Question 5.
The following table gives the distribution of the lifetime of 400 neon lamps:
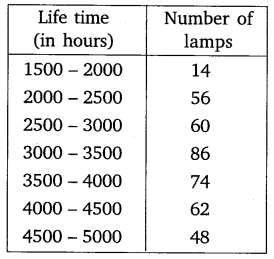
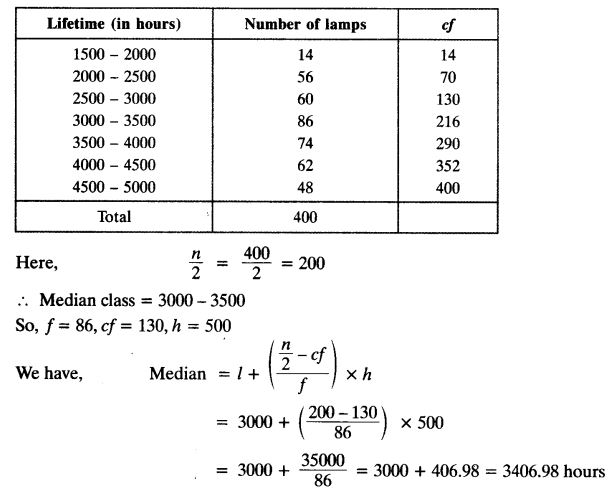
Find the median lifetime of a lamp.
Solution:
Question 6.
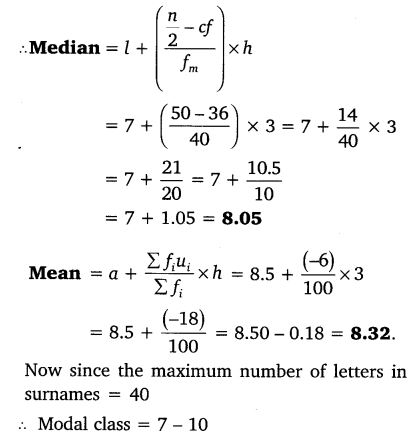
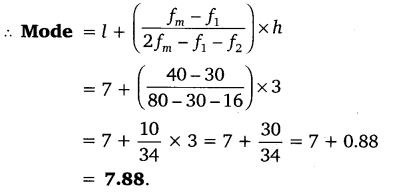
100 surnames were randomly picked up from a local telephone directory and the frequency distribution of the number of letters in the English alphabet in the surnames was obtained as follows:
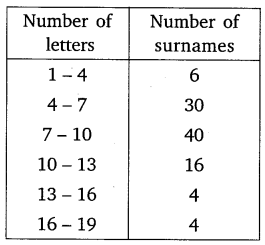
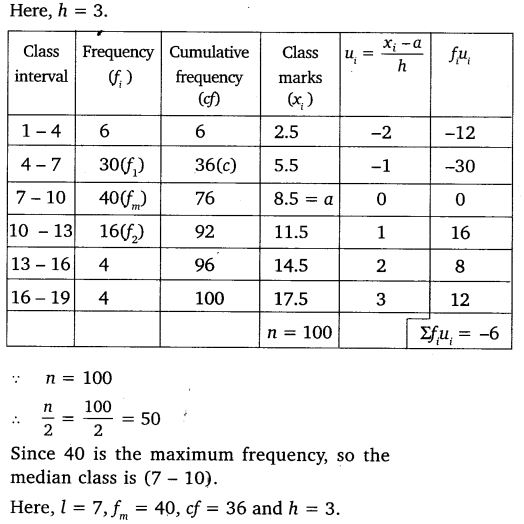
Determine the median number of letters in the surnames. Find the mean number of letters in the surnames. Also, find the modal size of the surnames.
Solution:
Question 7.
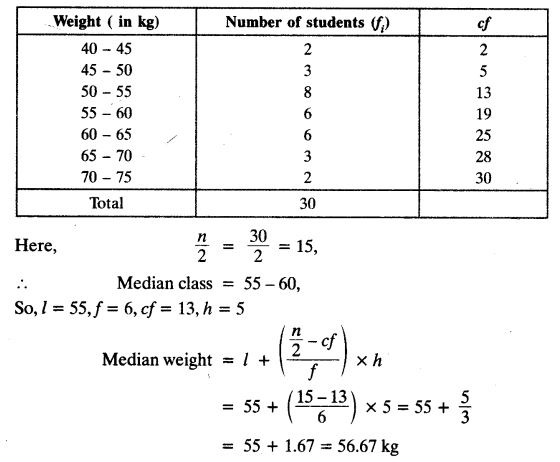
The distribution below gives the weight of 30 students of a class. Find the median weight of the students.
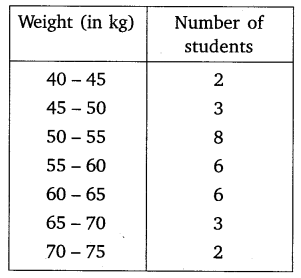
Solution:
Exercise 14.4
Question 1.
The following distribution gives the daily income of 50 workers of a factory.
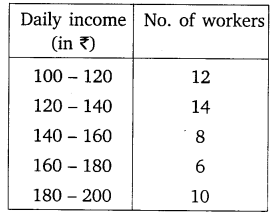
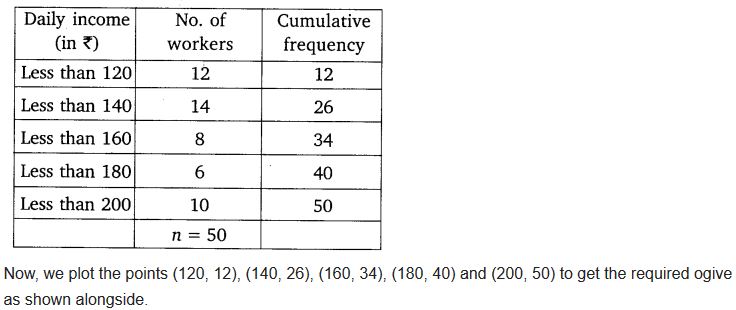
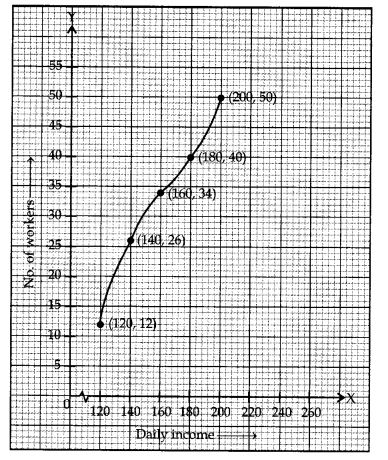
Convert the distribution above to a less than type cumulative frequency distribution, and draw its ogive.
Solution:
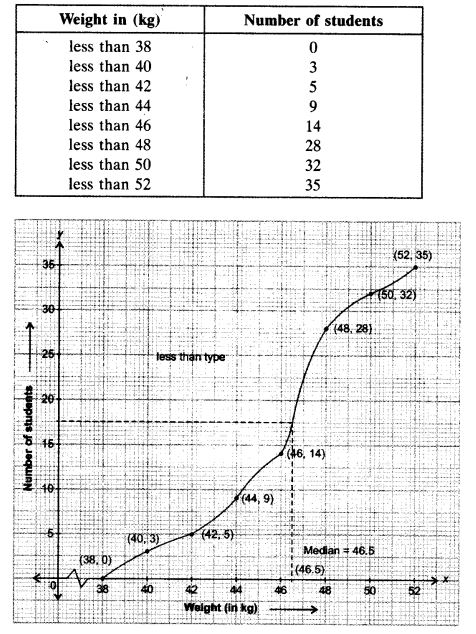
Question 2.
During the medical check-up of 35 students of a class, their weights were recorded as follows:
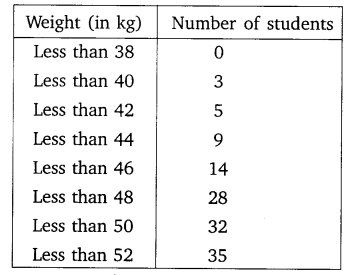
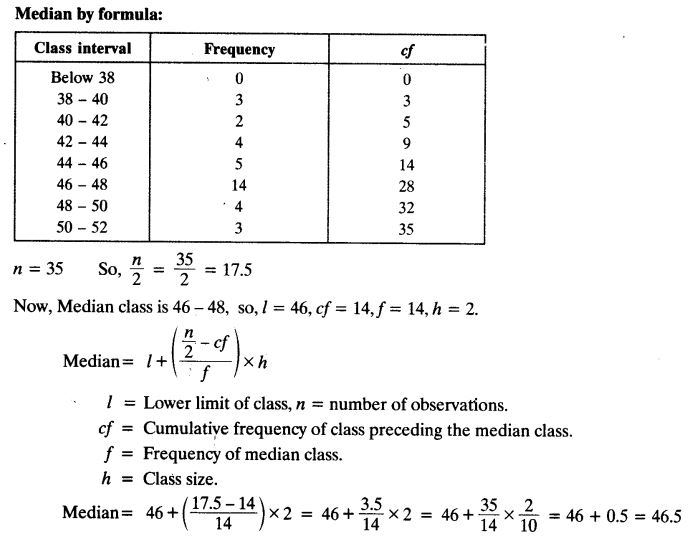
Draw a less than type ogive for the given data. Hence obtain the median weight from the graph and verify the result by using the formula.
Solution:
Question 3.
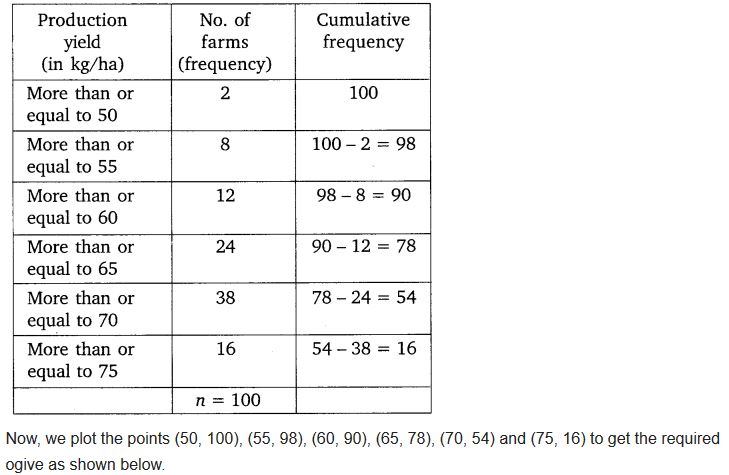
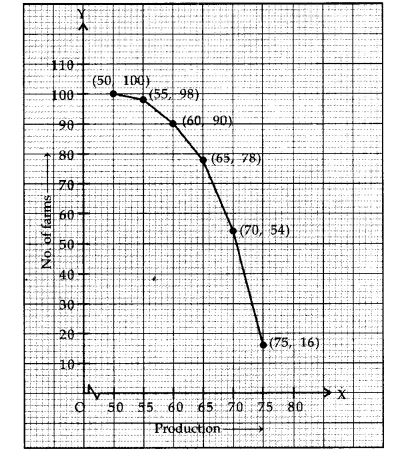
The following table gives production yield per hectare of wheat of 100 farms of a village.
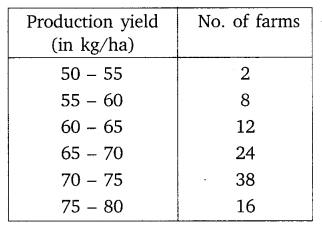
Change the distribution to a more than type distribution, and draw its ogive.
Solution: